People Performance Potential Model
A simple group profiling matrix tool for teams and organisations.
A Group-Profiling Matrix Tool
This elegant and simple model has been around in various forms for many years. Its precise origins are not clear. The model appears in different formats, with different terminology - and no doubt different titles of the model itself - although by implication the basic structure is constant, relying on a four-part 2x2 matrix, which is a common method of classification in management and beyond.
See also the pdf diagram, based on an interpretation kindly provided by John Addy, 2004.
The purpose of the model is to enable a simple assessment and representation of the mixture of types (according to potential and performance) within any work group or team, but it is a relatively blunt instrument and is neither designed nor recommended for detailed individual staff assessment.
The model provides a quick view or perspective of a group profile that often is elusive in complex human resources audits, and can assist in making investment decisions, although this apparently early purpose of the model should be approached with care given the more sophisticated expectations and considerations of modern organisational management.
It is therefore ideal for presentations and for reflecting a complex situation using a simple graphic.
The model is not for individual counselling and development, other than for reference and interest alongside more accurate and objective individual assessment tools and processes.
The ‘people potential performance model’ is especially useful in illustrating clearly and broadly the mix or profile of quite large groups of people within a human resources or organisational planning context. It is also helpful in understanding, determining, and explaining the different treatment that is appropriate for different categories of people with a group, according to local definitions and implications.
The model can also be used to show an ideal mix, and an actual mix, and thereby highlight the gap or difference, from an overall strategic viewpoint.
It can be a useful supplementary tool or reference point alongside more detailed and complex appraisals and training needs analysis processes
The model also has a good training and educational value, which is why it’s featured here. It can help managers and leaders to understand that people are different, have different needs, and can be helped in different ways and directions, appropriate to their situation.
Outline
Bear in mind that the descriptive terminology can be adapted to suit the situation and it is likely that the terms below have been adapted from those used when the model was first defined.
The notes in each quadrant are just a few examples of the sort of different responses and actions appropriate for each type.
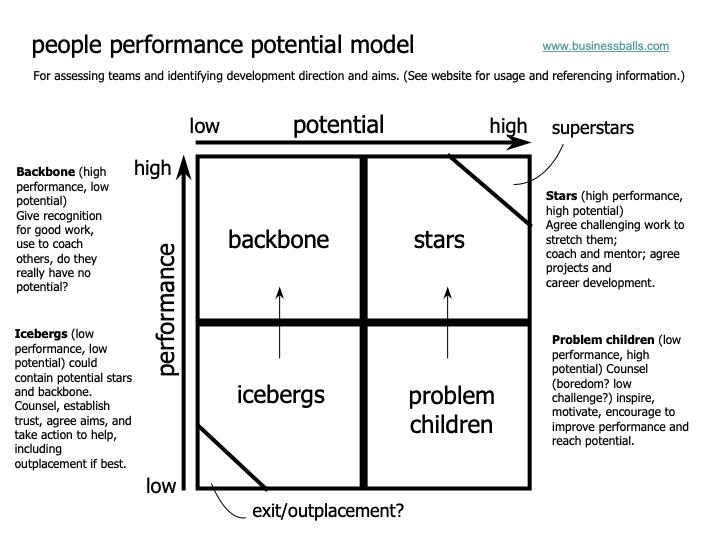
| low potential | high potential | |
| high performance | backbone > high performance low potential Acknowledge effort and contribution. Utilise as coaches and mentors. Look for each person’s hidden high potential, undiscovered passions, etc., and offer new challenges and responsibilities as appropriate, so these people too can be stars, to any extent they are comfortable. | stars high performance high potential Agree challenging stretching work, projects, career development, responsibilities, or these people are likely to leave. Give appropriately stretching coaching, mentoring, training. Explore and encourage leadership and role-model opportunities, to set and raise standards of other staff. |
| low performance | icebergs ^ or > low performance low potential Counsel, build trust, understand issues. Identify hidden potential. Facilitate more fitting roles, direction, purpose, opportunities, etc., linked with and perhaps dependent on performance improvement. Failing this, assist or enable move out of organisation if best for all concerned. | problem children ^ low performance high potential Confirm and acknowledge potential. Counsel, build trust, understand issues. Explore and agree ways to utilise and develop identified potential via fitting tasks and responsibilities, linked with and perhaps dependent on performance improvement. Explore attachment to backbone or star mentors and coaches. |
See the origins notes below about referencing the ‘people performance potential model’ (or whatever else it might be called). Precise origins are not certain.
Application
The model can be used both to visualise or represent the ideal or required staffing profile of a group or organisation, and separately, the actual staffing profile, according to the categories in the model, and thereby to see graphically and quickly the difference or gap between the two, i.e., in terms of staff mix, ‘what mix do we need’ versus ‘what mix do we have’?
As such it is a powerful tool for reflecting, seeing a complex picture simply and quickly, and therefore for presentation too.
Since the model enables very quick easy illustration or demonstration of a complex set of people-related factors that are highly significant for organisational performance and development, the tool is very useful for executives and executive discussions, presentations, reports and planning documents, etc.
While the model provides a quick simple easily-understood snapshot, remember it is not in itself a sophisticated or precise instrument for individual assessment.
Scoring questionnaires can be developed and used (see the example questionnaire/template for the performance/potential matrix below), or data may be used from performance appraisals and other assessment tools, however the model will always be a broad indicator and is not recommended ever to be used in isolation to make important decisions about people’d development and future careers.
As such, care must be taken when matching people to the categories. Ensure this is done consistently, and also ensure that appropriate supporting assessment methods are utilised for detailed action planning and to support discussions with individuals.
As with any assessment indicator, people have a right to see how they have been graded, and to be involved in the process at all stages. Accordingly, great sensitivity is required when explaining the system, and efforts should be made to temper potential disappointments with encouragements and opportunities to improve, with support as appropriate.
When using the model it is important to state any the assumptions, and the necessary criteria and measurement methods used in populating the categories.
You can adapt the model to suit your own situation, notably the terminology for the two axes and each quadrant, and also the criteria and definitions applicable to each quadrant.
If using a scoring system, the total scores for Performance and Potential equate to one of the four quadrant positions in the People-Performance-Potential Matrix. Scoring may also enable more detailed ‘mapping’ of positions of people within quadrants according to actual scores. Beware however of trying to make the model and assessment of people be overly sophisticated and detailed. It is a simple tool. Try to keep its usage simple and understandable too.
Questionnaire Template
Here is a simple quick example of a questionnaire which can be used to match people to categories in the ‘People-Performance-Potential Matrix’, described above. It’s an example. You can adapt it, simplify or expand it, according to your own situation.
It is very important that:
- assessments and scoring of people’s performance and potential is conducted in a consistent and fair way, and
- explanations and transparency of the process are managed sensitively and positively - everyone can be developed.
| ‘people performance potential matrix model’ questionnaire - template/example
Agree a score for each of these factors with each employee (using evidence and/or discussion as appropriate). Where factors are irrelevant remove them and adjust high/low total interpretation accordingly: | |
| Scoring scale: 1 - 4. Scoring key: 1= needs improving, 2 = satisfactory, 3 = good, 4 = excellent. (Interpretation for model positioning: 1-2 = low, 3-4 = high.) | Score
(1-4) |
| 1. Performance (factors relating to current job role - assess in detail as required, or import from appraisal/other assessment system) | |
| 1.1 Job skills | |
| 1.2 Job/product/technical knowledge | |
| 1.3 Attitude and behaviour (US-English: behaviour) | |
| 1.4 Commitment and flexibility | |
| 1.5 Effectiveness and results (mindful of obstacles, mitigation, situation) | |
| 1.6 Working relationships | |
| Performance total (up to and including 12 = low; 13 and over = high) | |
| 2. Potential (is there clear evidence of existing or developing [factors stated below] required beyond current role? N.B. scoring refers to evidenced potential, not to current level.) | |
| 2.1 Capabilities | |
| 2.2 Knowledge | |
| 2.3 Attitude/behaviour | |
| 2.4 Commitment and flexibility | |
| 2.5 Strategic awareness and effectiveness | |
| 2.6 Working relationships | |
| Potential total (up to and including 12 = low; 13 and over = high) | |
| The total scores for Performance and Potential equate to one of the four quadrant positions in the People-Performance-Potential Matrix. Conversion of scores to a matrix quadrant may simply be to a quadrant according to high or low classification, or may instead enable more detailed ‘mapping’ of positions within quadrants according to actual scores. | |
| © Alan Chapman, Businessballs.com, 2013 - see model and explanation at www.businessballs.com/people_performance_potential_model.htm | |
N.B. The scoring rationale used in the questionnaire template above assumes that a grading of ‘satisfactory’ does not represent ‘high’ performance or potential. If your own organisational situation considers ‘satisfactory’ as a ‘high’ level of performance or potential then amend the scoring terminology accordingly.
Origins
In terms of referencing the best I can suggest is that it is variously attributed to/claimed/adapted by Boston Consulting Group, George Odiome, Jack Welch, Doug Stewart, and Nicholas Barnes, c.1970-1996. The pdf diagram is based on an interpretation by John Addy, 2004.
Since publishing the model as a pdf diagram on the website in 2004 (based on an interpretation initially provided to me by John Addy, who was also unsure of its origins) I have received the following suggestions:
Lori M Beevers suggested (Sept 2005) that the model appeared in a book by George Odiome in the 1970’s and was credited to the Boston Consulting Group. The terminology was as above, except for these differences, which she suggested might have been updated to be less insulting, which seems a very reasonable observation: ‘icebergs’ = ‘deadwood’; ‘backbone’ = ‘workhorses’; and ‘problem children’ = ‘question marks’. In other respects the model and its basic meanings were as above.
Chris Page informed me (Jan 2007) that he had seen a simplified version of the model attributed to Jack Welch (General Electric Company, business writer/guru). The names of the four quadrants were not featured, and in what would arguably be typical Welch no-nonsense fashion, the recommended action associated with the ‘low potential - low performance’ category was to question why these people remain on the payroll. Apparently in this version of the model, ‘potential’ was extended to ‘potential to do a bigger job’, which is (in my view) a far narrower meaning and by implication ignores utterly one of the main points of the model: that many people thought to have no potential actually have tremendous potential that has neither been uncovered or utilised, which is why they are not performing well.
Tony Thacker informed me (Feb 2007): “Re. people performance model… Doug Stewart, in The Power of People Skills, p185, John Wiley, ISBN 0-471-01187-8, uses a somewhat similar quadrant model, but using skill and motivation as the two axes rather than performance and potential…”
Dr Nicholas Barnes informed me (also Feb 2007): “Re. people performance model… I can make a claim to have invented it with my boss at the time (Brian Lewis) when we were working in HR for a Danish (by registration) company called Borealis sometime around 1996. We used it once a year when we did succession and experience planning and was used based on peoples performance reviews. As it was used all over Europe (at least 9 countries) by our HROD staff it would certainly have leaked out into the wider world via local consultants as we found it very useful and presumably so would they…”
Tony Perryman provided the following helpful information, which supports the view that the original terminology was Deadwood, Workhorses, Problem Children and Rising Stars, (July 2007): “You will find a full explanation of this model in the Havard Business Review - around the mid to late eighties. The authors developed a more sophisticated view than in your explanation. They suggest that as a businessman the choice of where to invest is determined on where the best return is to be found, which should be so with people. So, Rising Stars are where to invest. Workhorses: maintenance investment or for motivation purposes; Problem Children: improve technical capability or knowledge; and Deadwood: no investment unless to be moved into a more appropriate role. I have been using this model since the early nineties, however because line managers become jittery about terms like deadwood, I just use A, B, C and D as a classification and sometimes D is the rising star!
| B - Workhorses Individuals who produce effectively, however they have reached their level of competency. | A - Rising Stars Individuals who have real potential for the future and are high performers. | hi p e r f o r m a n c e lo |
| D - Deadwood Individuals who have no potential and perform poorly. They are in the wrong role. | C - Problem Children Individuals who have potential but are not performing in their role. This may be because they are newly promoted. | |
| low potential high |
This simple method helps dictate where scare development resources should be spent:
- A - Rising Stars - Most investment. This is where the business is going to get the best return on there investment. Invest sufficient to keep engaged and grow for the future.
- B - Workhorses - Minimal investment. Invest only to keep motivated or to upgrade skills.
- C - Problem Children - Targeted investment. Action plan which includes giving them technical skills to perform at the required level. Any investment will only occur after full analyses of an individual’s motivation to move from where they are currently. If they do not respond move to another role or exit business.
- D - Deadwood - No investment. Action plan to either find a more appropriate role or exit business. ”
(With thanks to Tony Perryman, July 2007)
Michael Burgess wrote (July 2007): “My understanding of the Productivity Potential model origins has always been that it was from The Boston Consulting Group (Boston Matrix) used to evaluate products in terms of their market share and their potential for market growth. It’s self-explanatory how this applies to products and might go some way to explaining the rather harsh terminology when it was adapted by George Odiorne to describe employee performance.”
Cash Cow ‘milk’ - maintain | Star ‘shine’ - develop | hi m a r k e t s h a r e lo |
| Dog ‘shoot’ - exit/divest | Problem Child fix or divest | |
| low market growth or potential high |
(Thanks Michael Burgess, July 2007. See the detailed explanation of the ‘Boston Matrix’ in the business planning section.)
Jeffrey Cole wrote (February 2008): ”… In 1987 I saw this [people-performance matrix model] in a USMC leadership training manual from, I believe 1967, which is probably still in the library either at Camp Kinser, Okinawa Japan, or at the Combat Service Support Detachment at Takegahara Garrison (Gotemba prefecture), Japan. Given that this was in a Government training manual I believe that would indicate that the diagram is probably older than the 1970s. The labels on that diagram did not have cutesy names, it was simply ‘capability to learn’ and ‘willingness to perform’ and the quadrants reflected low/high for each attribute. The mentoring recommendations based on the diagram were essentially (for the axes - willingness to perform / capability to learn):
high/high : coach high/low: teach low/high: father (discipline) low/low: remove as quickly as possible.
| teach this person | coach this person | high willingness to perform low |
| remove this person | ’father’ (discipline) this person | |
| low capability to learn high |
(Diagram interpretation based on the above description provided by J Cole.)